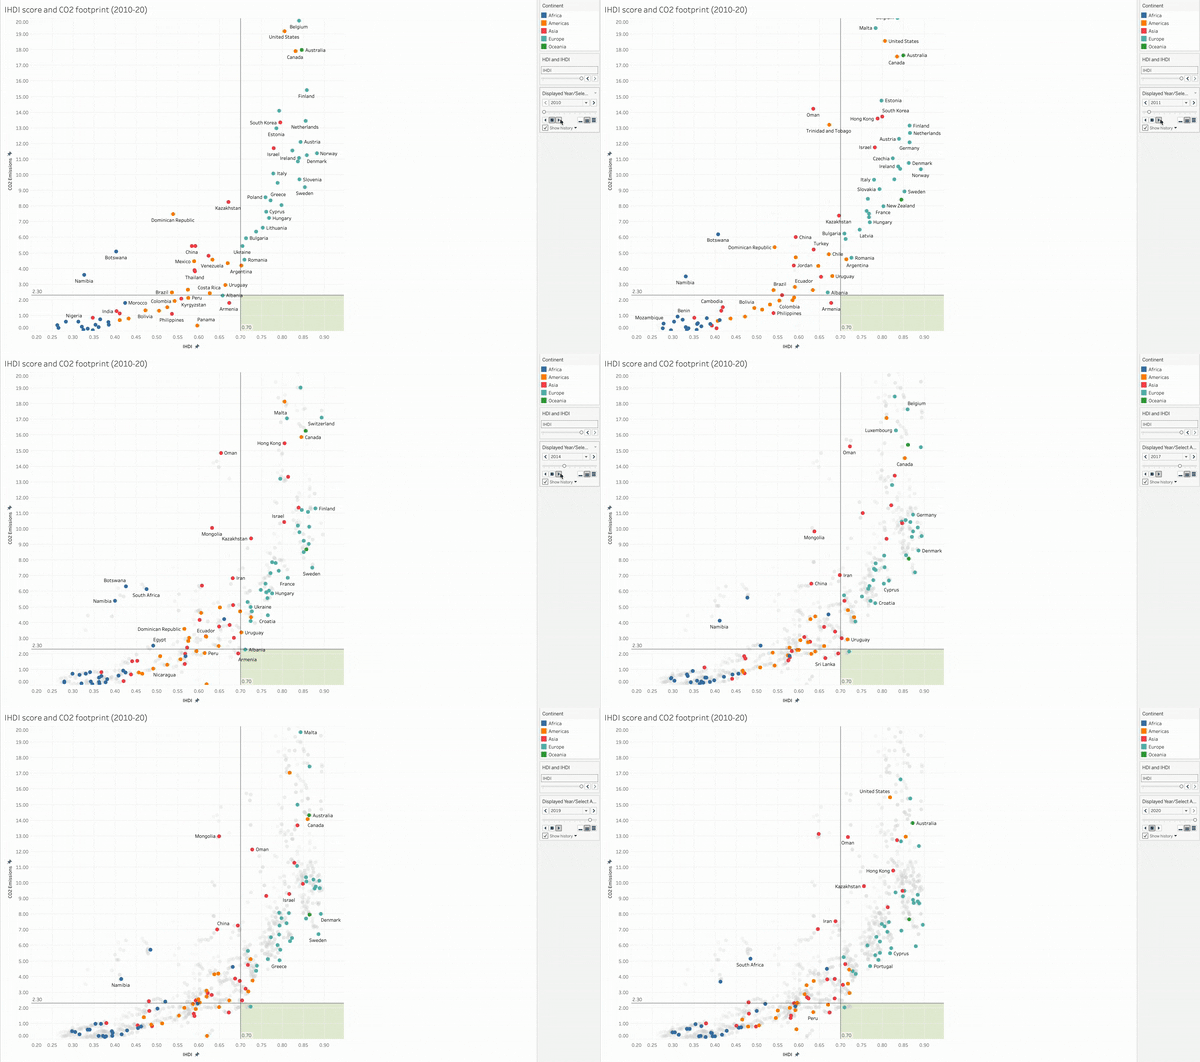
Visualizing Data on CO2 Emissions and Human Development
Three open source data sets wrestled and joined to analyze and visualize the relationship between emissions and development.
Tools used: Python (pandas, matplotlib), Tableau
Hi, I'm Timo.
Years of working in international affairs, combined with training as a data analyst, help me understand and address complex big-picture challenges. I am interested in using the vast amounts of information at our disposal to understand and address the complex challenges we face today. In the past, I have gained critical insight into strategic decision-making at the United Nations and a deep understanding of how to use analytics to better inform key decisions. Now, I am looking for a role that will allow me to use large data sets to understand complex trends while applying my skills in analysis, reporting and stakeholder management.
I excel in quickly analyzing complex and data rich contexts, identifying key problem points and developing solutions while maintaining a big-picture outlook.
I love the enriching experience of working with great people representing diverse and new perspectives, and collaborating to create a collective achievement.
I have extensive experience breaking down complex and sensitive issues into communications tailored to the needs of diverse audiences, including senior United Nations leadership.
My work has taken me around the world, requiring that I work well within culturally diverse teams, under tight deadlines, and facing complex challenges.

Three open source data sets wrestled and joined to analyze and visualize the relationship between emissions and development.
Tools used: Python (pandas, matplotlib), Tableau

Openly available web data on the attendance of a popular gym in New York City scraped, cleaned and visualized.
Tools used: Web Scraper, Excel, Tableau

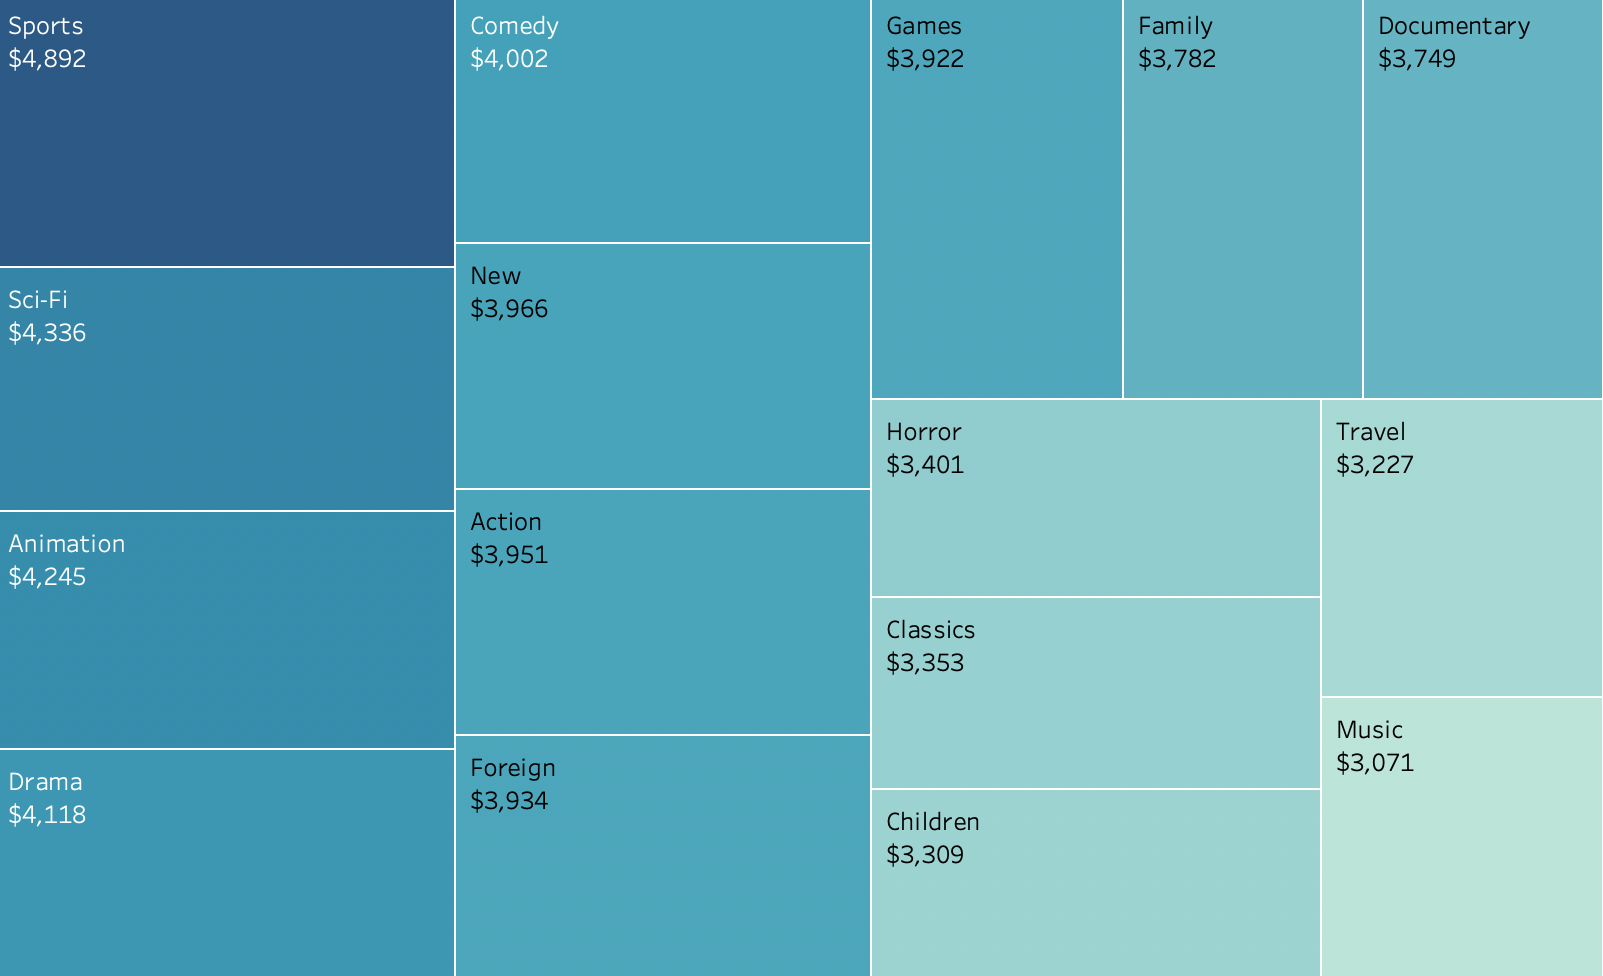
Created recommendations to inform a company strategy based on an analysis of inventory, customer and regional data stored in a SQL database.
Tools used: PostgreSQL (ETL, joins, CTEs), Tableau